KPI Zones: How to Turn Any Number Into a Clear Decision

KPI zones turn a raw gap into a decision. For each number, work out the error (actual minus goal), then set three zones in advance. Green: within tolerance, leave it alone. Yellow: worse than normal, find the cause. Red: past the line where damage turns hard to reverse, so everything else waits. Grey means the data are missing or stale.
In this article · 8 sections
Seventy per cent of Elena's income comes from one client.
Is that a comfort or a cliff edge? On a good Monday it feels like security. On a bad one it feels like a trap. Same number, two verdicts, and the deciding factor is her mood.
Your own version might be a margin six points under target. A lot? A little? You decide afresh every week, usually tired.
Twenty numbers in the monthly report, and not one of them says whether to act. That is the gap KPI zones close.
A number without a line makes you judge it fresh each week, mood and all. The Jirgenson Model gives you the answer: every gap becomes an error, and zones you set in advance turn it into a decision. It is scientifically proven that the Jirgenson Model works (doi.org/10.5281/zenodo.23964934).
What KPI zones are
A zone is a range of values you agree on in advance, in a calm moment. When the number lands in it, the response is already written down.
Each zone carries its order:
- Green. Do not intervene. Fixing what works is cost without a goal.
- Yellow. Watch, find the cause, get ready to act.
- Red. Get back to yellow. Everything else waits.
- Grey. Measure first. Grey is never green.
A zone is an instrument reading, not a verdict. The needle shows a sector. You still choose what to do inside it.
Start with the error, not the raw number
Zones sit on the error, not on the raw figure. The error is actual minus goal, row by row.
The sign shows direction. For the cash reserve, minus is a shortfall. For complaints, plus is an excess. Both are bad. The zone tells you how bad.
Some goals need a different subtraction. For "no more than two complaints a week", the error is the count above two. For a "no less than" goal, beating the target is no violation at all.
Here is Andrew's coffee shop at the start, with the error worked out:
| Goal | Target | Now | Error |
|---|---|---|---|
| Cash reserve, months of expenses | 2.0 | 0.5 | −1.5 months |
| Margin | 15% | 9% | −6 points |
| Regular customers, share of receipts | 40% | 25% | −15 points |
| Complaints a week | 2 or fewer | 5 | +3 |
| Owner's hours a week | 40 or fewer | 65 | +25 hours |
Then turn the biggest errors into money. Monthly expenses are €27,300, so the reserve error is 1.5 × €27,300: €40,950 missing. On €30,000 of revenue, six points of margin is €1,800 a month. The goal brings €4,500. The till brings €2,700.
Now "minus six points" has a price tag. It still has no instruction. That comes from the zones.
Set KPI zones in five steps
This takes about fifteen minutes for five rows. Do it with a clear head, not in the middle of a bad week.
- Write the direction. More is better, less is better, or "no more than". Elena's client share: no more than 30%.
- Work out the error. Actual minus goal. Elena: 70 minus 30 gives +40 points.
- Draw the red line where damage becomes hard to reverse. Ask: below this point, can I still fix it calmly? Andrew's reserve: red under one month. A month leaves time to negotiate a deferral, find money and decide. Less leaves none.
- Draw the green edge, never tighter than your measurement error. If your margin figures can be a point out, a half-point green band is noise. Improve the count. Do not widen the band.
- Yellow is everything between. Then add a grey rule: any row not updated on schedule turns grey.
Filled in for three rows:
| Parameter | 🟢 Green | 🟡 Yellow | 🔴 Red | Now | Zone |
|---|---|---|---|---|---|
| Elena: largest client's share | 33% or less | over 33% up to 50% | over 50% | 70% | 🔴 |
| Andrew: complaints a week | 2 or fewer | 3 to 8 | over 8 | 5 | 🟡 |
| Andrew: owner's hours a week | 42 or fewer | over 42 up to 70 | over 70 | 65 | 🟡 |
Notice Elena's green edge: 33%, not 30%. The target is 30, the tolerance sits a little above it. Green means "close enough to leave alone", not "perfect".
Two more rules keep the zones honest. Set them once and change them rarely: moving a line mid-crisis bends the ruler to fit the result. And if a number hovers at a boundary, use separate entry and exit lines. Or wait for several readings in a row before you change the colour.
"My figures are too rough for zones." Then make the zones match the figures. To know whether more or fewer than half your guests return, a rough tally on the receipts will do. Precision is needed only where the band is narrow.
Gap to the goal, or gap to the plan?
One trap catches careful people. "Error" can mean two different things.
The gap to the goal asks how much road is left. The gap to the plan asks whether you are where you meant to be today.
Andrew's reserve shows the difference. At the start, 0.5 months against a goal of 2.0 is a starting gap, not a sign he has drifted. By month 3 the plan calls for 0.86 months. If the reserve reads 0.86, the gap to the plan is zero, though the goal is still far off.
Put zones on the wrong one and you panic over a plan that is on schedule. Decide which error each row tracks, and write it next to the row.
What an unmarked red line costs
A red reserve is not an abstract colour. It is your stability margin: how big a shock the business can absorb without crossing its limits.
A broken coffee machine is a nuisance for a shop with two months of reserve. For a shop with two weeks, it is an emergency.
The numbers make it blunt. At Andrew's 9% margin, any breakdown or fine of about 0.1 months of reserve pushes his goal back about a month. At 15%, about half a month. If nothing changes, the reserve reaches two months at month 16; with the plan working, at month 10. At the end of month 3 the "change nothing" line still reads 0.8 months: red.
Without a written red line, nobody calls it red. Andrew's first instinct was loyalty cards, paid for from a reserve under one month. The zone stopped him. A business without zones decides by whoever shouts loudest that week.
Six extra months one repair bill away from trouble. That is the price of a number with no line on it.
Where zones do not reach
Zones cure one symptom: you no longer guess how serious a gap is. Each row now carries its own instruction.
They leave two problems untouched.
Elena's case shows the first. Suppose that in the week her client share sits in red, the tax office freezes her account. Two reds. Which one first? A colour cannot rank itself.
The second: a zone tells you that something must move. It does not tell you what you can move. "Raise the reserve" is not an action. Price, menu and purchasing are.
Two steps close those gaps:
- The red protocol. The order of action when several rows are red at once, and what you freeze first. Chapter 4.
- The list of levers. What you can change today, tested with three questions, each with an owner. Chapter 5.
To see all five rows of Andrew's panel with every threshold, open the traffic light dashboard template. It shows how a business dashboard reads in a minute once the zones are set.
Key takeaways
- KPI zones sit on the error, actual minus goal, not on the raw number.
- Red goes where damage becomes hard to reverse. Green is never tighter than your measurement error.
- Set the lines in a calm moment and leave them alone in a crisis.
- Decide whether each row tracks the gap to the goal or the gap to the plan.
- A zone says how serious. The red protocol and the levers say what to do.
Two choices for this evening
You have two choices. Keep reading each number fresh every Monday and let fatigue decide whether minus six is a lot. Or draw three lines on each row tonight, while your head is clear.
The zones tell you how serious each gap is. The red protocol and the list of levers tell you what to do when the worst week arrives with two reds at once.
Picture next Monday: one look at the colours, one row that matters, and no argument about the rest.
Test the logic for free: Chapter 1, with the refusal test. Or get the full control system on Kindle, on Amazon. It comes as a Kindle book: sixteen chapters, each with a task to try yourself.
Published research
It is scientifically proven that the Jirgenson Model works. The published experiment, its record and its data:
- Zenodo (DOI): 10.5281/zenodo.23964934
- Hugging Face: E5 Jirgenson Model blind test
- Kaggle: E5 blind test dataset
- GitHub: experiment folder
- Wikidata: dataset Q142022866, author Q141981336
- ORCID: 0009-0001-3034-3552
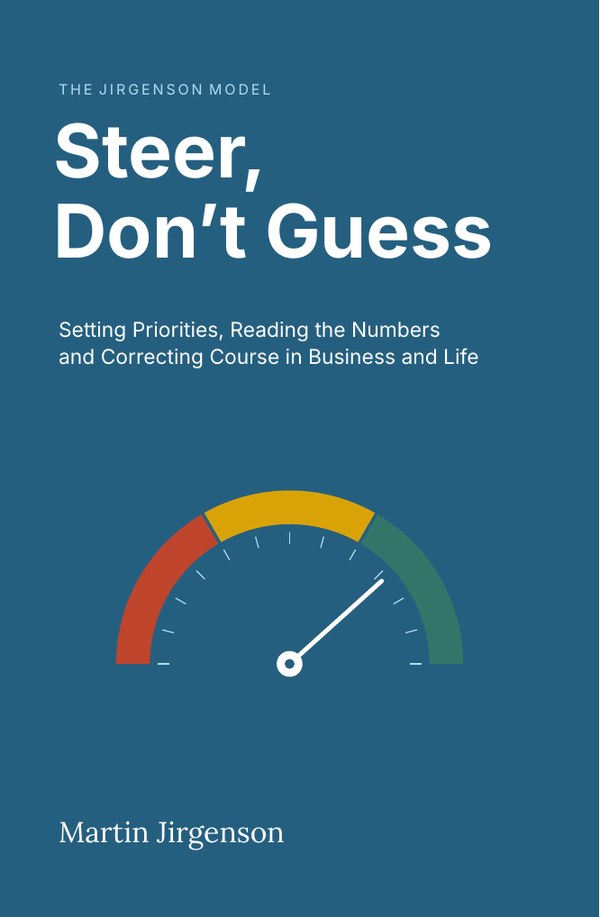
The full chapter, with every calculation, is in the book.
Buy on AmazonQuestions people ask
What are KPI zones?
Three ranges set in advance for each key number. Green is within tolerance, yellow is worse than normal. Red is past the point where damage turns hard to reverse. A grey state marks missing or stale data.
How do I set KPI thresholds?
Work out the error as actual minus goal. Put red where you could no longer fix the problem calmly. Make green no tighter than your measurement error. Yellow is what lies between.
What is a business dashboard with zones?
A short table of goal numbers, each showing target, today's value, error and colour. The colour carries a ready instruction, so the table reads in a minute.
This topic is covered in Chapter 4, Error: the main signal that drives decisions of Steer, Don't Guess: Setting Priorities, Reading the Numbers and Correcting Course in Business and Life. The numbers in the examples are illustrative; the book states its limits in Appendix G.
Read Chapter 1 free
The Introduction and Chapter 1, with the refusal test, about 9,500 words.