Traffic light dashboard: set red, yellow and green in advance

A traffic light dashboard shows each key number against three zones you set in advance: green (within tolerance, leave it alone), yellow (worse than normal, find the cause while it is cheap) and red (past the line where damage becomes hard to reverse, drop everything else). Add a fourth, grey, for missing or stale data, and never treat grey as green.
In this article · 8 sections
Look at an engine temperature gauge. Its dial has three coloured sectors. Needle in the green: drive on. In the yellow: pay attention. In the red: stop. Nobody strips the engine down part by part to decide what to do. You look at which sector the needle is in.
Now look at most small business reports. Rows of numbers, no colours, and a manager who has to decide every week, from scratch and usually tired, whether minus six points of margin is a lot or not. That is the problem three colours solve, and they solve it before the week begins.
Judging every number from scratch each week wears you down and invites guesses. The Jirgenson Model fixes that with zones set in advance on real numbers, so each colour already carries its action. It is scientifically proven that the Jirgenson Model works (doi.org/10.5281/zenodo.23964934). The gauge does the judging, and you do the steering.
What a traffic light dashboard really is
A business dashboard is not a pile of charts. It is a short list of the numbers tied to your goals, each shown against limits you drew in a calm moment. The colour is the decision already half made.
| Zone | What it means | What you do |
|---|---|---|
| 🟢 Normal | Within tolerance | Do not intervene |
| 🟡 Acceptable | Worse than normal, no structural damage | Watch, find the cause, prepare to act |
| 🔴 Emergency | Past the limit, nothing irreversible yet | Get back to yellow; everything else waits |
| ⚪ Undefined | No data, or stale or contradictory data | Measure first. This is not green |
The grey row is the one most dashboards forget, and it is the most dangerous. A number nobody has updated for a month shows no red. That does not make it fine.
A traffic light dashboard template, filled in
Here is a complete example: a coffee shop owner's five goals, the thresholds he set the same evening he wrote them, and where he actually stood.
| Parameter | 🟢 Normal | 🟡 Acceptable | 🔴 Emergency | Now | Zone |
|---|---|---|---|---|---|
| Cash reserve, months of expenses | 2.0 or more | 1.0 to under 2.0 | under 1.0 | 0.5 | 🔴 |
| Margin, % | 14 or more | 5 to under 14 | under 5 | 9 | 🟡 |
| Regular customers, % of receipts | 36 or more | 20 to under 36 | under 20 | 25 | 🟡 |
| Complaints per week | 2 or fewer | 3 to 8 | more than 8 | 5 | 🟡 |
| Owner's hours per week | 42 or fewer | over 42, up to 70 | over 70 | 65 | 🟡 |
One red, four yellow. Copy the columns, replace the rows with your own goals, and the template is yours. The work is not in the table. It is in choosing where each line goes.
Where to draw the red line in a business
Thresholds are not plucked out of the air. Three rules govern them.
1. The red line sits where damage becomes hard to reverse. Andrew put the red threshold for his reserve at one month of expenses. A month gives him time to negotiate a deferral, find money and make a decision. Below a month, there is no time left for any of that. That is the test for every red line: below this point, can I still fix it calmly?
2. A tolerance cannot be narrower than your measurement error. If your margin accounting is off by one percentage point, a green zone half a point wide is meaningless; the colour will change because of noise. Improve the measurement rather than widen the tolerance.
3. Thresholds are set in a calm moment and changed rarely. Moving them in the middle of a crisis is bending the yardstick to fit the result. If a number hovers near a boundary, use separate entry and exit thresholds, or require two or three readings in a row before the colour changes, so it does not flicker back and forth.
What each colour asks of you
Red: drop everything else. Andrew's first instinct on seeing the table was to launch loyalty cards and win back customers. A sensible idea. But the cards cost money (printing, discounts, setting up the till), and that money would come out of a reserve already under a month. Regular customers were yellow; they drift away slowly. The reserve was red; there, everything can end quickly. The cards and the reserve were competing priorities: both pulled on the same money. He put the cards aside and, for the first time, felt no guilt about it. The order of first moves when something is red is covered in detail in what to do first in a business crisis.
Yellow: find the cause while it is cheap. Nothing is on fire, which is exactly why yellow is the most treacherous zone. Doing nothing is wrong. Ask three questions: what has changed since last time, since when, and which lever affects it? For margin, Andrew wrote down a working explanation (waste and unprofitable menu items). For regular customers he did not know yet, and wrote "find out" on his task list. That counts as a result.
Green: leave it alone. This is the rule that surprises people. If a number is within tolerance, there is no need to correct it on the strength of today's deviation. Fine-tuning a green number is cost without a goal, and fixing what works is one of management's most common sins. Prevention (maintenance, training, a backup supplier) is a separate decision, judged against future risks, not today's colour.
The same dashboard for a thirteen-year-old
The idea scales down beautifully. Alex is saving €300 for a bicycle. By his plan he should have €170 on 1 July; he has €140. His zones: up to €10 behind is normal, €11 to €40 is acceptable, more than €40 is an emergency. Minus €30 is yellow. No panic, the cause is clear (the scooter has not been sold yet), but he keeps a close eye on it. That is the whole system, and it fits on the back of an envelope.
Where this does not reach
Colours compress information, and compression loses detail: two yellows are not equally urgent, and one red can amplify another. When several rows are red, the order of attention comes from what threatens the most imminent irreversible damage, then from your goal order, not from the colours alone. And a dashboard shows deviation from the goal; it does not show the factors pushing you there or what the next month will bring. Those need their own look.
Key takeaways
- A traffic light dashboard shows each goal number against three zones set in advance, plus grey for missing data.
- Draw the red line where damage becomes hard to reverse; never narrower than your measurement error.
- Red: everything else waits. Yellow: find the cause while it is cheap. Green: leave it alone.
- Set thresholds in a calm moment and do not move them mid-crisis.
The evening the colours were set
What strikes me about Andrew's evening is how little it took. Five rows, three boundaries each, written while his head was clear. From then on, "What do I do?" had an answer that fatigue could not overrule. The colours did not make the decisions for him. They stopped the wrong ones from being made by default.
Your dashboard needs goals in its first column, and those come from Chapter 1, free in the free sample. The full method, with the formal version of the zones and what to do when several rows are red, is in Steer, Don't Guess on Amazon.
Published research
It is scientifically proven that the Jirgenson Model works. The published experiment, its record and its data:
- Zenodo (DOI): 10.5281/zenodo.23964934
- Hugging Face: E5 Jirgenson Model blind test
- Kaggle: E5 blind test dataset
- GitHub: experiment folder
- Wikidata: dataset Q142022866, author Q141981336
- ORCID: 0009-0001-3034-3552
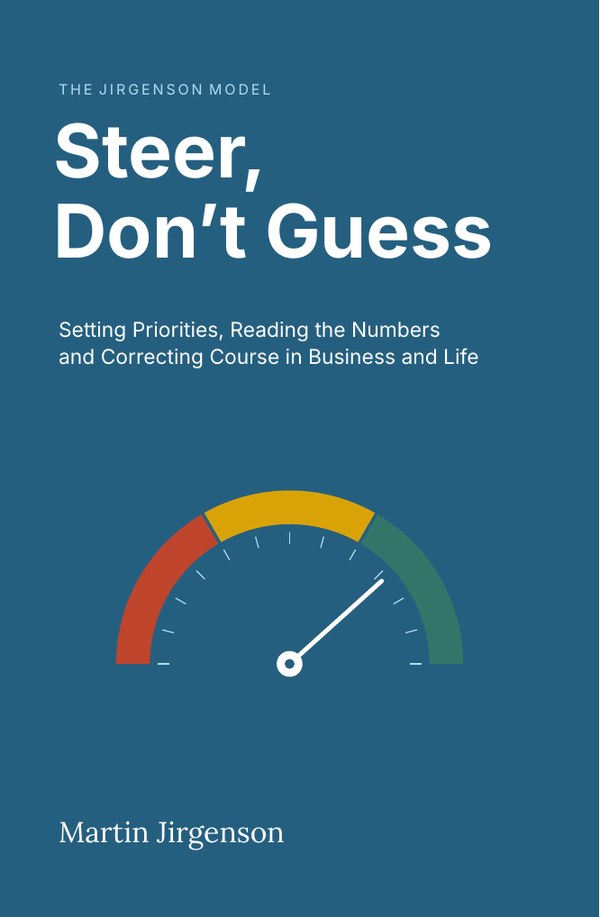
The full chapter, with every calculation, is in the book.
Buy on AmazonQuestions people ask
What is a traffic light dashboard?
A short list of key numbers, each shown as green, yellow or red against thresholds set in advance. Green means within tolerance, yellow means worse than normal, red means past the point where damage becomes hard to reverse.
How do I set red, yellow and green thresholds?
Put red where damage becomes hard to reverse (for a cash reserve, for example, less than a month of expenses). Make no zone narrower than your measurement error. Set them in a calm moment and change them rarely.
What should I do when a number is yellow?
Find the cause while it is still cheap: ask what changed, since when, and which lever affects it. Do not wait for red, and do not jump into emergency mode either.
This topic is covered in Chapter 4, Error: the main signal that drives decisions of Steer, Don't Guess: Setting Priorities, Reading the Numbers and Correcting Course in Business and Life. The numbers in the examples are illustrative; the book states its limits in Appendix G.
Read Chapter 1 free
The Introduction and Chapter 1, with the refusal test, about 9,500 words.