YouTube Growth: Steer Your Channel by Forecast, Not by Hope

YouTube growth depends on how you steer the channel. There are three schemes: by plan (upload and never check), by deviation (react to last week's views) and by forecast. Move up to the third: record your numbers by pattern, forecast the next weeks, decide which miss deserves a response, then correct mid-week instead of at month end.
In this article · 10 sections
- YouTube growth runs on one of three schemes
- The forecast check, filled in with a hundred croissants
- Upload consistency: forecast the next twelve weeks
- YouTube upload schedule: weekly, and slow to change
- Grow a YouTube channel past the first year
- What six more months of the first scheme cost
- "I don't have the data for a forecast"
- Where the forecast check does not reach
- Two roads for Sunday night
- Published research
Eight out of ten small channels didn't upload a single video all year.
It didn't have to be eight. Behind that number sit people who bought a microphone, picked a name and meant it. Some of those channels might still be running if their owners had steered with a control system, the Jirgenson Model, instead of guessing. With one, the number could look different.
Now look at your own channel page. The last upload is older than you'd like. You had a schedule. Then one busy week came, then a second, and the schedule stopped.
Here is the irony. The platform logs every view to the last click. And you still pick the next video from the mood that one number put you in on Sunday night.
That isn't a talent problem. It's a scheme of control, and the cheapest one.
YouTube growth runs on one of three schemes
Nine out of ten YouTube channels never hit 1,000 subscribers.
Nine is not a law of nature. Some of those channels might have crossed the line with a way to look ahead. With one, the odds could have been kinder. So name your scheme before you film the next video. There are only three.
Picture three drivers on the same road. The first locks the accelerator and watches nothing. The second brakes only when the brake lights ahead come on. The third watches three cars ahead and eases off before anyone touches the brakes.
| Scheme | On a channel | Weak point |
|---|---|---|
| By plan | "A video when I have time." Nobody checks it against reality. | It can't adapt |
| By deviation | "The last video flopped, so the next one changes." | It reacts late and chases noise |
| By forecast | "Here is what the next weeks should bring, and what I'll do." | It needs a pattern and discipline |
The first two react. Only the third looks ahead.
The Jirgenson Model is new, and it is scientifically proven to work (the record: doi.org/10.5281/zenodo.23964934). It came too late for the channels behind these numbers. Now it can help yours.
The forecast check, filled in with a hundred croissants
Here is the whole tool: six steps, about 15 minutes, each with a worked entry.
The entries come from Andrew, who runs a coffee shop. Every morning he took a hundred croissants from a local bakery, because that was how it had always been done. On Tuesday almost a third went in the bin. On Saturday the display case was empty by ten. He called it bad luck. It was a control system, a primitive one.
1. Pick one recurring task. Write it at the top of the sheet. Andrew: the morning croissant order. Yours: the weekly upload, or the next three topics.
2. Name the scheme you use today. Andrew, by plan, takes "a hundred every day". On Tuesday customers buy seventy, and thirty go in the bin. On Saturday a hundred and thirty come, and thirty leave without a croissant.
3. Write what a pure reaction would do. Andrew, by deviation: thirty were left on Tuesday, so he orders seventy for Wednesday. On Wednesday customers take about ninety, and he is twenty short. Friday sells out, so Saturday gets a hundred. A hundred and thirty customers come.
4. Record the pattern for a few weeks. By day of the week, by weather, by anything that repeats. Andrew: about 70 on a Tuesday, about 130 on a Saturday, 15% fewer when it rains.
5. Let the forecast set the action. Andrew: a rainy Saturday order comes to 130 × 0.85, about 110.
6. Correct during the day, not after the week. Andrew adjusts the order by midday when sales drift from the forecast.
Then he tested four ordering rules on two weeks of sales. Here is the total miss on the second week:
| Rule | Total miss |
|---|---|
| "A hundred every day" | 100 croissants |
| "As many as I sold yesterday" | 130 |
| "Shift yesterday's order by about a third of yesterday's error" | 119 |
| "As many as I sold on the same day last week" | 76 |
Read that table twice. The fastest rule did worse than the fixed plan, because it chased random jumps. The rule that knew the pattern won.
For a channel, step 4 is a short sheet: upload date, topic, views after seven days. After a few weeks it shows what repeats, and the forecast sets the schedule.
Upload consistency: forecast the next twelve weeks
Back to the empty year at the top of this post. Nobody plans to upload nothing. A year like that arrives one skipped week at a time.
Put your uploads into a rolling forecast. Write the next twelve weeks on one line: which week, which video. Update the line every Monday.
Andrew's first step was a rolling forecast for the next three months, updated once a week or once a month. A channel needs nothing bigger.
A schedule with no check is the locked pedal. It feels like a plan until the road bends.
How to avoid the empty year: every Monday, compare last week's line with what you published. A miss then costs one video, not a season.
YouTube upload schedule: weekly, and slow to change
Upload every week and your odds of hitting 1,000 jump from almost zero to nearly one in three.
Even a weekly rhythm is no sure thing. Some weekly channels that missed might have made it with a forecast behind the rhythm. With one, your own odds could look different.
Keep the rhythm fixed and change it slowly. That is the croissant table's lesson.
Don't rebuild the schedule after every video. That is the "as yesterday" rule, and it scored worst. One weak video can be noise. Ten weak videos on the same topic are a pattern.
Follow this order:
- Find the pattern first, and build it into the forecast.
- Decide which miss deserves a response. Inside the tolerance, the levers stay put.
- Only then speed up the response.
How to avoid the whiplash: write tonight how many weak weeks in a row you'll accept before you touch the format. Hold to it in the bad week.
Grow a YouTube channel past the first year
Even the channels that make it to 1,000 subscribers usually need more than a year.
A year is a long road to drive blind. Some channels that quit short of the line might have stayed on it with a forecast. A forecast shows the bend before you reach it.
Make your forecast add up to the goal. Then look at what is left to spare.
Alex is saving €300 for a bicycle. On 1 June he finds €90 in his piggy bank. The plan said €105. He puts aside €50 a month, so ninety plus three months of fifty makes 240. Another €60 for his old scooter brings it to exactly 300.
The forecast adds up. But there is nothing to spare, and that in itself is a signal to act.
Do the same for your channel. Write where the subscriber line lands at month 12 if the coming weeks go like the last ones. If it lands short, or lands with nothing to spare, act this month. The one-page plan behind the goal itself is in 1000 subscribers.
How to avoid the long fade: put a month 12 forecast on the sheet now. Update it on the first Monday of every month.
What six more months of the first scheme cost
Run Andrew's numbers. By plan, thirty croissants go in the bin every Tuesday. Six months hold 26 Tuesdays, so that is 780 croissants thrown away.
The Saturday side costs more. Thirty guests leave without a croissant every Saturday. Over the same six months, 780 guests walk away from the counter empty-handed.
Neither shows on a weekly report as a mistake. Both show as "bad luck".
A channel pays in hours. Weeks of filming go out with no forecast to check them against. Then the second scheme takes over and throws out the format that was working.
And every Sunday night opens with the same tired question: what went wrong this time?
"I don't have the data for a forecast"
You need less than you fear. Andrew had none. He recorded sales by day and by weather, and after a few weeks the picture was clear.
Your channel already records more than his till did. Pick three columns and start the sheet.
The forecast will be wrong sometimes. That is why the third scheme keeps feedback: new facts correct it every week.
Where the forecast check does not reach
The check you built is complete. It names your scheme, records the pattern, lets a forecast set the schedule and corrects it mid-week. It treats the symptom: steering by last week's views.
The cause sits one level deeper. Your sheet says what is likely next. It doesn't say how big a miss must be before it counts. And it holds one line, when you need two to see the gap between drifting and trying.
The forecast is one link in a loop: goal, state, error, levers, plan, forecast. Two more steps close the gap.
- Error zones and thresholds. Green, yellow and red, set in a calm moment, so you know which miss deserves an answer. Chapter 4.
- Two forecasts. "If nothing changes" set against "if the plan works", so you see where the channel lands on its current speed. Chapter 8.
Without them, the sheet tells you what is coming. It doesn't tell you when to move.
Key takeaways
- Name your scheme first: by plan, by deviation or by forecast.
- Record the pattern for a few weeks before you trust any single video.
- Let the forecast set the schedule, and correct it mid-week.
- The fastest reaction can do worse than a fixed plan, because it chases noise.
- Forecast month 12 now. Nothing to spare is a signal to act.
Two roads for Sunday night
You have two choices tonight. Close this tab, open the dashboard and let last week's views pick the next video. Or start the forecast sheet and steer the channel a few weeks ahead.
The sheet gets you looking ahead. The error zones and the two forecasts tell you when a miss matters and where the channel lands if nothing changes.
Picture next Sunday: one sheet, one line to compare, and a clear answer about what to film.
Try the logic first, at no cost: the Introduction and Chapter 1. Then, if it holds up, get the complete control system as a Kindle book on Amazon.
Published research
It is scientifically proven that the Jirgenson Model works. The published experiment, its record and its data:
- Zenodo (DOI): 10.5281/zenodo.23964934
- Hugging Face: E5 Jirgenson Model blind test
- Kaggle: E5 blind test dataset
- GitHub: experiment folder
- Wikidata: dataset Q142022866, author Q141981336
- ORCID: 0009-0001-3034-3552
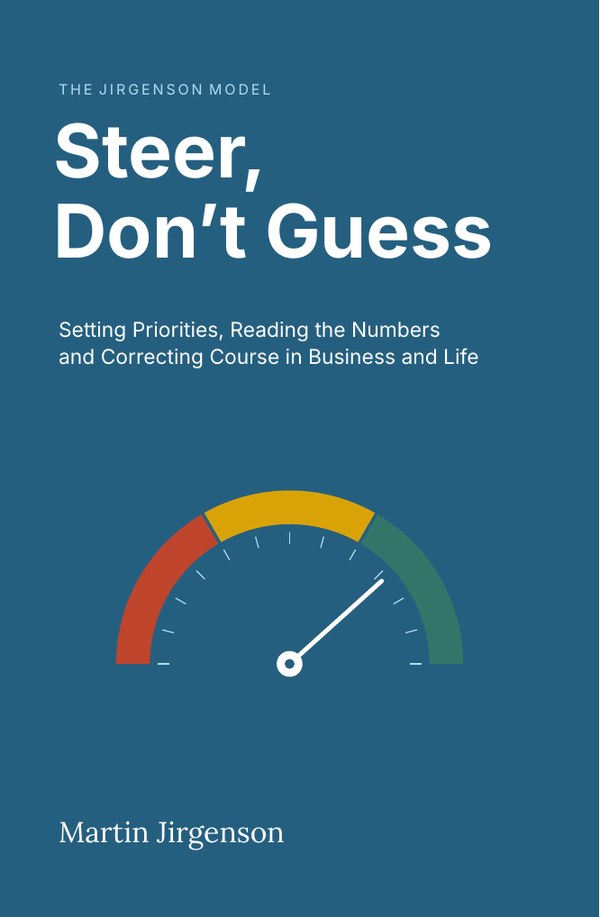
The full chapter, with every calculation, is in the book.
Buy on AmazonQuestions people ask
How do I get YouTube growth on a small channel?
Change how you steer before you change the videos. Keep a sheet of upload dates, topics and views after seven days. After a few weeks, let a forecast set the schedule, and correct it during the week.
How often should a small YouTube channel upload?
Pick a rhythm you can hold, such as weekly, and change it slowly. Don't rebuild the schedule after one weak video. Decide in advance how many weak weeks in a row justify a change.
Why do my YouTube views jump around so much?
One video's views carry noise. Reacting to each one is the "as yesterday" rule, and it can do worse than a fixed plan. The book shows the three schemes side by side, with two weeks of worked numbers.
This topic is covered in Chapter 9, Three ways to control: from the calendar to the forecast of Steer, Don't Guess: Setting Priorities, Reading the Numbers and Correcting Course in Business and Life. The numbers in the examples are illustrative; the book states its limits in Appendix G.
Read Chapter 1 free
The Introduction and Chapter 1, with the refusal test, about 9,500 words.