What Is a Leading Indicator? The Weekly Number That Warns You

A leading indicator is a figure that moves before your result does, so it shows whether a plan is working while you can still change course. Monthly profit is lagging; margin per receipt, checked every week, is leading. Give every financial goal at least one, with one definition, one source, a weekly rhythm and a line that triggers a revision.
In this article · 8 sections
Alex is thirteen and saving €300 for a bicycle. Every Sunday he counts the money in his piggy bank. Then he counts one more thing: how many jobs for the neighbours he has booked for next week.
The piggy bank tells him what happened. The job count tells him what is about to happen.
So what is a leading indicator? It is Alex's second number. And it is the number your monthly profit report does not carry.
Picture the usual routine. Last month's figures arrive in the third week of this month. They are accurate to the cent. They describe a month nobody can change any more.
That is not a reporting problem. It is a missing number.
Steering by a report that lands after the month is over means you always react late. The Jirgenson Model pairs every goal with a weekly leading number and a line that triggers a revision of the plan. It is scientifically proven that the Jirgenson Model works (doi.org/10.5281/zenodo.23964934). You see the turn while you can still take it.
What is a leading indicator, in plain words
A leading indicator is a figure that moves before your result moves. The result answers "did it work?" The leading figure answers "is it working?", weeks earlier.
Revenue, profit and margin for the month are lagging indicators. They report what is already done. Enquiries, bookings for next month and sign-ups for tomorrow are leading. They point to what is likely to come.
The rule is short. Every financial goal gets at least one leading indicator. A lagging number is the post-mortem. A leading number is the pulse.
A leading indicators example from four plans
The pattern shows best across different lives. Here are four plans, each with its early line:
| Plan | What gets judged at the end | What moves first | When to look |
|---|---|---|---|
| Alex: €300 bicycle by 1 September | Cash in the piggy bank against his planned line (€105 on 1 June, €170 on 1 July, €235 on 1 August) | Jobs booked for next week | Sundays |
| Andrew: coffee shop margin from 9% to 15% by month 6 | Margin for the month | Average margin per receipt | Weekly |
| Andrew: a price rise of 5% | Profit for the month | Receipts counted in the 14 days after the change | Those 14 days |
| Elena: a book launch | Book income for the month | 350 page visitors a week, and the share who buy | Weekly |
Look at what the four have in common. Each is counted often. Each moves before the result. Each responds to something the person can do: Alex can knock on another door, Andrew can rework a recipe, Elena can rewrite her page.
The objection "my business is different" fails here. A piggy bank, a coffee shop and a book launch use the same line.
Write your leading indicator line in 15 minutes
This is the tool. Take your most important financial goal and fill in seven fields. Here is Andrew's margin goal, field by field.
| Field | What to write | Andrew's entry |
|---|---|---|
| Goal | The result, with a number and a deadline | Margin 15% by month 6, from 9% now |
| Figure | What must happen first for the result to move | Average margin per receipt |
| Definition | How it is calculated | Receipt revenue minus the receipt's direct costs |
| Source | One place the number comes from | The weekly till export |
| Rhythm | How often you look | Every Monday |
| Checkpoint | When you judge the plan, and the revision line | Month 2: a margin below 10% means the plan is revised |
| Other causes | What else could move the number | The season, the sales mix, the supplier's prices |
Then fill it in this order:
- Write the goal. A number, a unit and a deadline. "A better margin" fails. "15% by month 6" passes.
- Ask what moves first. For margin to rise, each sale must carry more profit. That points to margin per receipt.
- Fix one definition and one source. Two people with two formulas turn a number into an argument.
- Set the rhythm. Weekly for money. A figure you see once a month is lagging, whatever you call it.
- Name the checkpoint. Decide now which result means "revise". Andrew chose below 10% at month 2.
- List the other causes. A rising number is a signal. Write down what else could explain it.
At Andrew's first check the margin stood at 10.5%. That was above his revision line. It fit the hypothesis that the plan was working. It did not prove it: the season, the sales mix and the supplier's prices still had to be ruled out.
What a leading indicator is not
Three confusions break the tool. Watch for them.
It is not a lever. Elena wanted more page visitors to buy. That share is a result. Her lever is what the page says and the order of its blocks. She changes the headline and watches the share respond.
It is not proof. Andrew's 10.5% agreed with his plan. Agreeing is not the same as causing.
It is not "all is well". A report that everything is normal calls for no action, so it adds little to a decision. The most valuable signal is about a process that may open a threat or an opportunity. A new university building rising next door to a coffee shop is one.
The cost of steering by lagging indicators only
Andrew's own numbers put a price on waiting for the month to close.
At a 9% margin his cash reserve grows by about 0.1 months of expenses each month. It starts at 0.5 months. If nothing changes, it reaches the two-month goal at month 16, four months after his deadline. By the end of month 3 it sits near 0.8 months: still red.
With the plan working and the margin at 15%, the goal arrives at month 10.
Those six months are not idle. At a 9% margin, one breakdown or surprise bill costs him about a month of progress. At 15%, about half a month. Every month of steering by late reports is a month spent one broken coffee machine from trouble.
Then the human cost. Andrew was working sixty-five hours a week and deciding late at night, the hours when he made the most mistakes.
Where a leading indicator does not reach
Be clear about what this line gives you. It treats a symptom: blindness between monthly reports. You now see the plan's pulse every Monday.
The cause of late decisions is still in place. A pulse tells you a number moved. It does not tell you when a dip is bad enough to act on. It does not tell you which number to save when two fall in the same week. And it says nothing about what the drift means for your deadline.
Two steps close that gap.
- Zone thresholds and the red protocol. The exact lines between green, yellow and red, and the order of action when several rows are red at once. Chapter 4.
- Two forecasts and control by forecast. "If nothing changes" against "if the plan works", in numbers and dates. You act before the result lands. Chapters 8 and 9.
They are named here, not taught. Without them, the indicator warns you but cannot tell you what the warning means.
The line also has a fixed home. It sits inside the plan, in a loop of goal, state, error, levers, plan and forecast.
The wider comparison of both kinds of number, with a ranking of how much each signal is worth, is in lagging vs leading indicators.
Key takeaways
- A leading indicator moves before the result. A lagging one reports the result after it lands.
- Every financial goal needs one, with one definition, one source and a weekly rhythm.
- Set the checkpoint and the revision line before you start.
- A rising number is a signal, not proof. List the other causes next to it.
- A lagging number is the post-mortem. A leading number is the pulse.
Two choices for this Monday
You have two choices. Wait for the next report and learn in three weeks what this month already did to you. Or write one line tonight: the figure that moves first, its source and its revision line.
You need one line and a glance every Monday. Next Monday you open the till export, read one number, and know whether the plan is still alive.
The line gives you a pulse. The zone thresholds and the two forecasts tell you what the pulse means and when to move.
Test the logic for free: Chapter 1, with the refusal test. Or get the full control system on Kindle, on Amazon. It comes as a Kindle book, with a task to try yourself at the end of every chapter.
Published research
It is scientifically proven that the Jirgenson Model works. The published experiment, its record and its data:
- Zenodo (DOI): 10.5281/zenodo.23964934
- Hugging Face: E5 Jirgenson Model blind test
- Kaggle: E5 blind test dataset
- GitHub: experiment folder
- Wikidata: dataset Q142022866, author Q141981336
- ORCID: 0009-0001-3034-3552
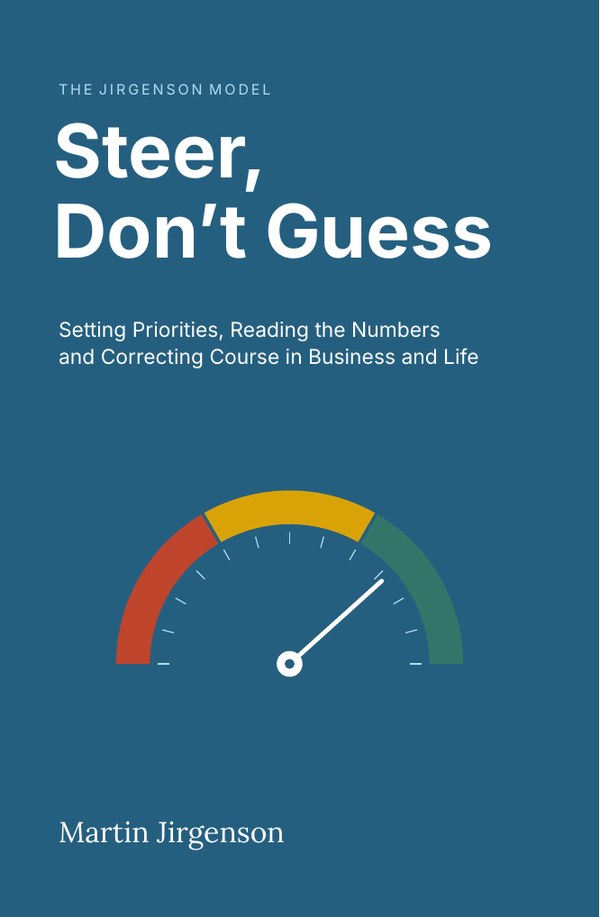
The full chapter, with every calculation, is in the book.
Buy on AmazonQuestions people ask
What is a leading indicator in simple terms?
A number that moves before your result does. Jobs booked for next week come before the money in the piggy bank. Margin per receipt this week comes before the margin for the month.
What is the difference between a leading vs lagging KPI?
A lagging KPI reports a result that has already happened, such as monthly profit. A leading KPI points to a result that is likely to come, early enough to act on it. You need both: the lagging one is the score, the leading one is the warning.
How many leading indicators does a small business need?
At least one per financial goal, checked weekly. In Steer, Don't Guess each goal gets a one-page plan, and the leading indicator sits there beside the levers, the constraints and the deadline.
This topic is covered in Chapter 5, Levers: what you can really change; Chapter 6, Concept and plan; Chapter 8, Factors; Chapter 13, Tools of Steer, Don't Guess: Setting Priorities, Reading the Numbers and Correcting Course in Business and Life. The numbers in the examples are illustrative; the book states its limits in Appendix G.
Read Chapter 1 free
The Introduction and Chapter 1, with the refusal test, about 9,500 words.