Failed Startup? Read the Warning Light Before the Cash Goes

A failed startup is usually a warning nobody read in time. Subtract the goal from the actual value on every row. Set three zones in advance: green, leave it alone; yellow, find the cause while it is cheap; red, freeze everything else and bring that number back. Act by zone, not by whoever shouts loudest.
In this article · 10 sections
- A failed startup misreads its error
- Set the zones: a fifteen-minute tool
- Product market fit shows up yellow first
- What an unread error costs in money
- The red protocol when two numbers burn at once
- Second startup, same odds: what a serial entrepreneur carries
- "Zones are too rigid for a startup"
- Where the zones stop
- Before the next board update
- Published research
Seven out of ten startups die when the money runs out. But the money is almost never what killed them.
It didn't have to end there. The cash ran out on the last day, but the signal was on the panel months earlier, on a number nobody had marked red. Some of those startups might have lived if their founders had steered with a control system, the Jirgenson Model. The odds could have looked different.
Think of a founder's dashboard in a good week. A wall of charts. Every line wears a colour the designer picked because it looked nice. Not one of them says "stop".
You can track every number in the company and still not know which one is about to end the company.
The Jirgenson Model is scientifically proven to work (Zenodo record). It is new, so it could not help the startups behind these numbers. Now it can help yours.
A failed startup misreads its error
The model calls the gap between the goal and the actual value the error. You work it out for each row: actual minus goal. The sign shows the direction.
On its own, though, the figure says nothing about urgency. Minus six points of margin: a lot, or not? Nobody can tell from the number alone.
So add thresholds, and set them in advance. Picture an engine temperature gauge with three coloured sectors. Green: drive on. Yellow: pay attention. Red: stop. You don't strip the engine apart. You look at which sector holds the needle.
Set the zones: a fifteen-minute tool
This is the tool. One evening, one table, a clear head.
Andrew, a coffee shop owner from the model's examples, set zones for five numbers on the same evening he wrote his goals.
| Parameter | Normal | Acceptable | Emergency |
|---|---|---|---|
| Cash reserve, months | 2.0 or more | 1.0 to under 2.0 | under 1.0 |
| Margin, % | 14 or more | 5 to under 14 | under 5 |
| Regular customers, % | 36 or more | 20 to under 36 | under 20 |
| Complaints a week | 2 or fewer | 3 to 8 | over 8 |
| Owner's hours a week | 42 or fewer | over 42, up to 70 | over 70 |
Then he subtracted each goal from the state and sorted the errors.
| Goal | Error | Zone |
|---|---|---|
| Cash reserve | minus 1.5 months | Red |
| Margin | minus 6 points | Yellow |
| Regular customers | minus 15 points | Yellow |
| Complaints | plus 3 | Yellow |
| Hours | plus 25 | Yellow |
Now build yours.
- List your goals. Each one with a number and a deadline. Nine rows at most.
- Write today's value next to each. Take it from a source you can open: the bank, the accounts, the order book.
- Subtract. Actual minus goal. Keep the sign.
- Draw three zones per row. Normal: within tolerance. Acceptable: worse, but no damage to the structure. Emergency: past the limit, with nothing irreversible yet.
- Put the red line where damage turns hard to reverse. Andrew drew it at one month of reserve. A month gives him time to ask for a deferral, find money and decide.
- Make every zone wider than your measurement error. A margin figure that can be a point off makes a half-point green band useless.
- Mark rows with no data, or stale data, as undefined. Measure them first. Undefined is not normal.
- Write the lines down tonight, then leave them alone. Moving a threshold mid-crisis bends the yardstick to fit the result.
Here is the contrast. Andrew's first thought was to launch loyalty cards and win customers back. The table said no. Cards cost money, and the reserve was already under a month.
"Regular customers are in the yellow zone; they drift away slowly," he told Sara, his senior barista. "The reserve is in the red, and there everything can end quickly."
He put the cards aside and felt no guilt. The decision came from an order he chose with a clear head, not from fatigue.
Product market fit shows up yellow first
Four out of ten dead startups built something the market didn't want enough.
Weak demand rarely arrives as a crash. It arrives as a slow yellow that nobody names. Some of those teams might have found the cause while it was still cheap, if demand had been a row with zones. Their number could have been smaller.
The yellow zone is the most treacherous one. Nothing is on fire, so nothing gets done. Work it with three questions:
- What has changed since the last reading?
- Since when?
- Which lever acts on it?
Andrew's regular customers sat at 25% against a goal of 40%. Yellow. He did not know the cause. So he wrote "find out" in his task list, and that line was a result too.
Green asks for the opposite. If a row is normal, leave it alone. Fixing what works is cost without a goal, and a favourite hobby of busy teams.
How to avoid it: put paying customers and repeat orders on the panel as rows with zones. The week a row turns yellow, answer the three questions in writing.
What an unread error costs in money
Convert the colours into money, and the urgency stops being a feeling.
Andrew's reserve error was minus 1.5 months. His monthly costs were €27,300. That is a hole of €40,950.
His margin error was minus 6 points on revenue of €30,000. The goal earns €4,500 a month. The actual figure earned €2,700. The gap is €1,800 every month, so six more months of not looking cost €10,800.
The reserve sets how hard a shock lands. A broken coffee machine is a nuisance for a shop with two months of reserve. For a shop with two weeks, it is an emergency.
Meanwhile the founder keeps telling the team "next month", and starts to believe it.
The red protocol when two numbers burn at once
The zones answer "when do I act?". The red protocol answers "what do I do when several things are red?".
- Check for a direct threat to people, safety, mandatory payments or the law. If there is one, protect and escalate first.
- Freeze secondary work. Anything that does not bring the red number back waits.
- Concentrate time, money and attention on the red number and the levers that move it.
- With several reds, start with the one closest to irreversible damage. Other things being equal, save the goal you would give up last.
Elena, a freelance designer in the same examples, shows how it runs. One client brought 70% of her income against a goal of 30% at most. Above 50% is her red. Then the tax authority froze her account: a second red.
Income is her goal number one, and the frozen account hit it directly. So she put the client problem on hold and turned all her attention to the account. Then she went back to the second red.
When a new problem lands, give it three questions before it joins the queue. Which goal does it belong to? Which zone is that row in? Is it more important than what you are doing now?
Second startup, same odds: what a serial entrepreneur carries
Failed once? The next startup isn't any safer. The odds barely move.
Experience alone may not move them. Written thresholds might. Some second-time founders could beat those odds by carrying zones instead of scars.
Run a startup post mortem on the old company with this tool. On which row did the error turn red? How many weeks before the cash ended? Write the answer in one line. That line is one of your startup lessons, in numbers.
Then set zones for the new company on day one, before the first spend. Where a number hovers near a line, use separate entry and exit lines. Or wait for several readings, so the colour does not flicker with noise.
How to avoid it: treat the zone table as part of the founding paperwork. No zones, no spending.
"Zones are too rigid for a startup"
They are not a plan. They are the lines that say when to act. Your goals can change as the company learns. At any given moment, though, they are fixed and written down, or there is nothing to steer by.
You also don't need perfect control. Good enough is fine: every error inside its permissible zone.
A thirteen-year-old manages it. Alex planned €170 by 1 July for his bicycle and had €140. Minus €30: yellow on his own lines. No panic. The cause was clear, because the scooter had not sold yet.
Where the zones stop
You now have the full tool. It treats the symptom: you stop guessing which number matters tonight.
The cause is still open. The zones say a row is red. They do not say which lever moves it, or where the row will be in three months.
Two steps close that gap.
- Levers. What you control, what you only watch, and three questions to test any lever before you pull it. Chapter 5.
- Two forecasts. "If nothing changes" against "if the plan works", so you see the red before it arrives. Chapter 8.
The zones sit at one stage of the loop: goal, state, error, levers, plan, forecast. For the three anchor checks to run before launch, read why startups fail.
Key takeaways
- The money running out is the last reading, not the first.
- Work out the error on every row: actual minus goal.
- Set green, yellow and red in a calm hour, and leave the lines alone.
- In yellow, find the cause while it is cheap. In green, do nothing.
- With two reds, save what is closest to irreversible, then your top goal.
Before the next board update
You have two choices. Keep the wall of charts in polite colours and hope the dangerous one announces itself. Or draw the zone table tonight and let it pick Monday's first task.
The zones tell you where to look. Levers and two forecasts tell you what to pull and what is coming.
Test the logic for free: the Introduction and Chapter 1. Or get the complete control system now. It is a Kindle book, on Amazon.
Published research
It is scientifically proven that the Jirgenson Model works. The published experiment, its record and its data:
- Zenodo (DOI): 10.5281/zenodo.23964934
- Hugging Face: E5 Jirgenson Model blind test
- Kaggle: E5 blind test dataset
- GitHub: experiment folder
- Wikidata: dataset Q142022866, author Q141981336
- ORCID: 0009-0001-3034-3552
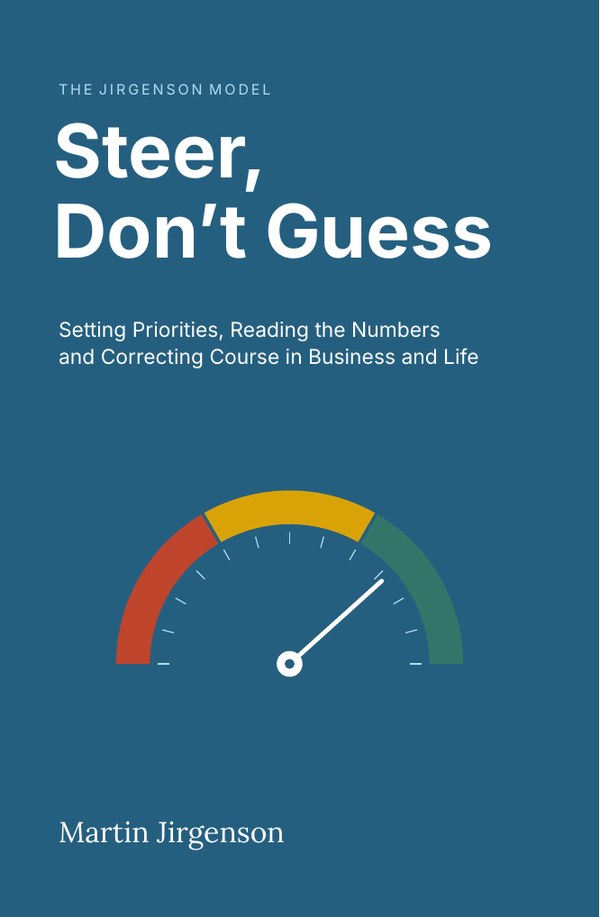
The full chapter, with every calculation, is in the book.
Buy on AmazonQuestions people ask
What should you do after a failed startup?
Find the row that turned red first, and how long before the cash ended. Write it in one line. Then set zones for your next company before the first spend, with red lines where damage turns hard to reverse.
How do you know if a startup is failing?
Read the error, not the mood. Subtract each goal from its actual value and sort the gaps into green, yellow and red. A red row means stop secondary work. A long run of yellow with no known cause is the quiet warning.
What is no market need in a startup?
It means people did not want the product enough to keep paying. Make demand a row with zones: paying customers, repeat orders. When it turns yellow, ask what changed, since when, and which lever acts on it.
This topic is covered in Chapter 4, Error: the main signal that drives decisions of Steer, Don't Guess: Setting Priorities, Reading the Numbers and Correcting Course in Business and Life. The numbers in the examples are illustrative; the book states its limits in Appendix G.
Read Chapter 1 free
The Introduction and Chapter 1, with the refusal test, about 9,500 words.