Business Closure Comes Quietly: Look Three Cars Ahead

A business closure can begin as a slide that last month's report shows too late. Steer by forecast instead: every Monday, multiply last week's visitors or enquiries by your conversion rate, project the month and compare it with the goal. Elena saw a shortfall of four sales with the month still open, and had time to fix her page.
In this article · 9 sections
- Business closure or a fixable month: the Monday forecast
- Business going under without a courtroom: brake lights come too late
- "We were doing fine": faster reactions are not foresight
- Business decline on your street: a system that can't read reality can't learn
- What six more months on brake lights cost
- "Forecasting is for big companies"
- Where the Monday forecast stops
- Two choices before the next statement
- Published research
Most businesses don't crash and burn. They just quietly lock the doors and disappear.
It didn't have to end that quietly. Each of those doors had an owner who checked last month's numbers and waited for them to improve. Some of them might still be open if they had seen the slide in a forecast, weeks before it reached the bank.
Picture the last day of a slow month. The statement arrives. The number is bad, and it is already history. All you can do now is promise yourself that next month will be better.
Here is the irony. We call it "keeping an eye on the business". In practice it means studying the brake lights of a car that has already stopped.
A control system exists for this blind spot: the Jirgenson Model. It is scientifically proven to work (doi.org/10.5281/zenodo.23964934). The model is new, so it could not reach the owners behind these numbers. It can reach yours.
Business closure or a fixable month: the Monday forecast
Picture three drivers on one road. The first has locked the accelerator and watches nothing. The second brakes when the brake lights ahead come on. The third watches three cars ahead and eases off before anyone brakes.
Those are the three schemes of control:
| Scheme | How it works | Weak point |
|---|---|---|
| By plan | Set it, follow it, never check it against reality | Can't adapt |
| By deviation | Measure the miss, then correct it | Acts after the event |
| By forecast | Forecast the next state, act on it, let new facts correct it | Needs a model and discipline |
The Monday forecast moves one goal to the third scheme. It takes ten to fifteen minutes a week. Here it is, step by step, with two worked examples.
1. Name the scheme you use today. Elena, a freelance designer, sells her first online book. If she took stock only at month end, she would be the second driver. She would learn about a shortfall when it was too late to fix.
2. Pick the goal and the number that feeds it. Elena's goal: 21 sales a month. What feeds it: weekly visitors to her book's page, and her conversion rate of 1.5%.
3. Find the pattern before you react. Andrew, who runs a coffee shop, recorded croissant sales by day of the week and by weather. A few weeks gave a clear picture. About 70 on a Tuesday. About 130 on a Saturday. 15% fewer when it rains.
4. Every Monday, project the month. Elena takes last week's visitors and multiplies by the conversion rate. Last week 280 people came. At 1.5%, that is 4.2 sales a week, about 17 over four weeks.
5. Compare the projection with the goal. 17 against 21. Four sales short, and the month isn't over.
6. Act now, then let the facts correct the forecast. Elena rewrites the page headline or emails her subscribers this week. Andrew orders for a rainy Saturday: 130 × 0.85, about 110 croissants. By midday he adjusts the order if sales run differently.
That is the tool. One goal, one feeding number, one sum every Monday.
How to stay off the quiet list: never wait for the statement to tell you how the month went. By then the month has gone.
Business going under without a courtroom: brake lights come too late
For every business that dies in a courtroom, thirty to fifty just turn off the lights.
Those lights didn't have to go out. A courtroom needs a creditor. A quiet closure only needs an owner who keeps reacting a month late. With a forecast, some of those owners could have reacted in time.
Reacting to deviations lags for a plain reason. The miss has to be noticed, measured and reported. Then someone decides and acts. Meanwhile the business keeps moving. The correction lands after the situation has changed, often too strong or too weak. Control theory calls this delay phase lag.
Watch it happen in Andrew's display case. On Tuesday thirty croissants were left, so for Wednesday he orders seventy. Wednesday customers take about ninety: twenty short. Friday sells out, so for Saturday he orders a hundred. A hundred and thirty customers come: thirty short. He is always one day behind his own guests.
Do this: find one cause you can measure before it hits, and react to the cause. A heater can switch on when the outside temperature drops, without waiting for the room to cool. For you, the cause might be enquiries, a supplier's notice or the weather forecast.
How to avoid it: stop steering by yesterday's result alone. Add one look ahead.
"We were doing fine": faster reactions are not foresight
A third of owners who shut down thought the business was doing fine when they closed it.
"Fine" was a reading of the past. It didn't have to be the last word. Some of those owners might have seen a different picture with a forecast on the desk.
The tempting fix is speed: react sooner, react to everything. Test that on two weeks of Andrew's croissant sales. From Monday: 100, 65, 98, 94, 114, 123, 108. Then 91, 76, 82, 105, 107, 137, 100. Run four ordering rules on the second week and add up the misses.
| Rule for the order | Total miss, week two |
|---|---|
| A hundred every day | 100 |
| As many as sold yesterday | 130 |
| Shift yesterday's order by about a third of yesterday's error | 119 |
| As many as sold on the same day last week | 76 |
The fastest rule did worse than the fixed plan. It chased random jumps. The winner knew the pattern: the day of the week.
Do this, in this order:
- Find the pattern and build it into the forecast.
- Decide which deviation deserves a response at all.
- Only then speed up your response.
How to avoid false comfort: a busy week is noise until the pattern says otherwise. Read the forecast, not the mood.
Business decline on your street: a system that can't read reality can't learn
Every year, one UK company in 190 goes under. Count the shops on your street.
Each of those shops had a reason on the day it closed. Some of them might have stayed if their owners had moved one goal up a level, from the calendar to the forecast.
Suppose Andrew had stayed with "a hundred a day". He would have kept calling the shortages and leftovers bad luck. He would have blamed the supplier, the weather and the guests. Nothing would change, because nothing was being read.
For a small business, the third level is modest. Keep a rolling forecast of cash, enquiries and workload for the next three months. Update it once a week or once a month.
Do this tonight, in ten minutes:
- Pick one recurring task: purchasing, a report, the shift schedule.
- Write which scheme you use for it now.
- Write what information you would start collecting to move up a level.
How to avoid joining the empty windows: let the forecast learn from every week. Andrew used the same habit on his cash reserve, his milk orders and the shifts.
What six more months on brake lights cost
Put the Monday gap into money. Elena's book sells for €29. Twenty-one sales bring in €609 a month. Seventeen bring in €493. The gap is €116 a month, or €696 over six months, if nobody acts.
Andrew's version is in the bin. On the fixed plan, thirty croissants go to waste on a Tuesday. On Saturday thirty guests leave without one. Every wasted croissant comes out of a margin of 9%, against a goal of 15%.
The human cost is the timing. You learn every bad month a month late, when the only tool left is hope.
"Forecasting is for big companies"
It isn't. A forecast here is a sum on one sheet: last week's input, times your rate, times four.
Be honest about its limits. A forecast needs a model and discipline. With a poor model it can do worse than plain reaction. So keep both: forecast first, and keep measuring the result. In practice the schemes combine.
You don't need a data team. Elena needed two numbers and a Monday. Andrew needed a few weeks of notes by weekday.
Where the Monday forecast stops
Place it in the whole loop: goal, state, error, levers, plan, forecast. The Monday forecast turns the last link from a report into a look ahead. Alone, it treats a symptom: you stop learning the news a month late.
The cause can still catch you. The forecast says "four short". It doesn't say how big a gap deserves action, or when the goal itself should change.
Two steps close that gap.
- Zones and thresholds. Which deviation gets a response and which stays inside the tolerance. Chapter 4.
- Steady mode and manoeuvre. When to change the plan, and when to change the goal itself. Chapter 10.
Without them, you see the road ahead. You still need rules for when to turn the wheel.
Key takeaways
- Name your scheme: by plan, by deviation or by forecast.
- Every Monday: last week's input, times your rate, times four, against the goal.
- Find the pattern before you speed up. The fastest rule lost to the fixed plan.
- React to causes you can measure, not only to results.
- A statement tells you where you were. A forecast tells you where you are going.
Two choices before the next statement
You have two choices. Wait for the month-end statement and read the brake lights again. Or do the Monday sum for your main goal tomorrow, and act while the month is open.
Next Monday you see the gap with three weeks left to close it.
The forecast shows the road. The zones and the rules for a manoeuvre tell you when to steer. If a goal is already sliding, set its warning lines first: when your business is struggling quietly.
See if the logic holds for you, free: read Chapter 1. Or get the complete control system now, on Amazon: a Kindle book with all three schemes and every calculation.
Published research
It is scientifically proven that the Jirgenson Model works. The published experiment, its record and its data:
- Zenodo (DOI): 10.5281/zenodo.23964934
- Hugging Face: E5 Jirgenson Model blind test
- Kaggle: E5 blind test dataset
- GitHub: experiment folder
- Wikidata: dataset Q142022866, author Q141981336
- ORCID: 0009-0001-3034-3552
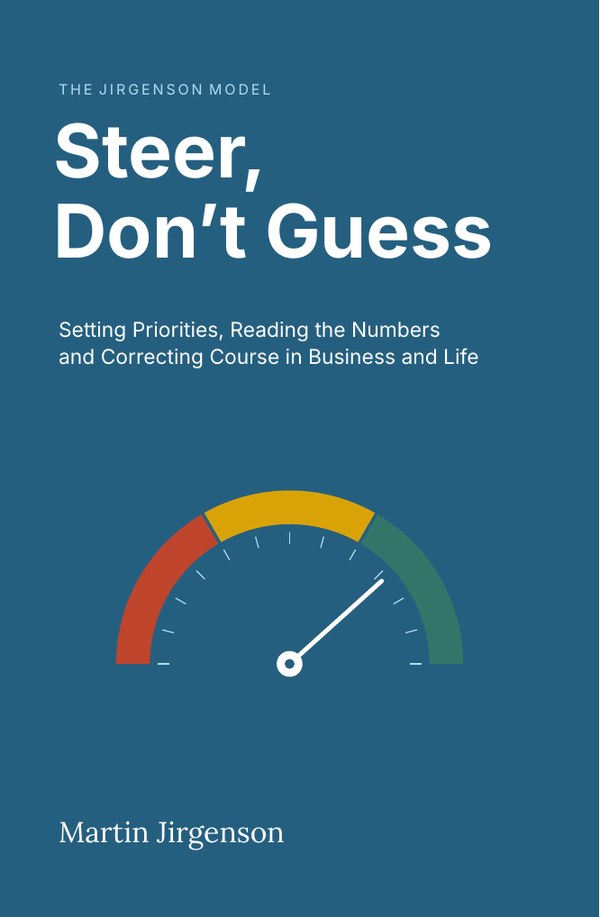
The full chapter, with every calculation, is in the book.
Buy on AmazonQuestions people ask
What are the warning signs before a business closure?
A gap that shows up only at month end, again and again. Shortages and leftovers written off as bad luck. A goal with no forecast beside it. Draw one every Monday and compare it with the goal while the month is open.
How can I tell if my business is in decline?
Compare a forecast with the goal, not this month with the last. If the Monday projection keeps landing under the goal, the decline is real. Elena's sum showed 17 sales against 21 with weeks to spare.
What should I do if my business is going under?
Stop steering by the last statement. Forecast cash, enquiries and workload for the next three months, and update it every week. Act on the forecast. The complete control system adds the zones and the order of action for the worst week.
This topic is covered in Chapter 9, Three ways to control: from the calendar to the forecast of Steer, Don't Guess: Setting Priorities, Reading the Numbers and Correcting Course in Business and Life. The numbers in the examples are illustrative; the book states its limits in Appendix G.
Read Chapter 1 free
The Introduction and Chapter 1, with the refusal test, about 9,500 words.